2% DA for the month of July 2016 – AICPIN for the month of July 2016:
No. 5/1/2016-CPI
GOVERNMENT OF INDIA
MINISTRY OF LABOUR & EMPLOYMENT
LABOUR BUREAU
CLEREMONT, SHIMLA-171004
DATED: 31st August, 2016
Press Release
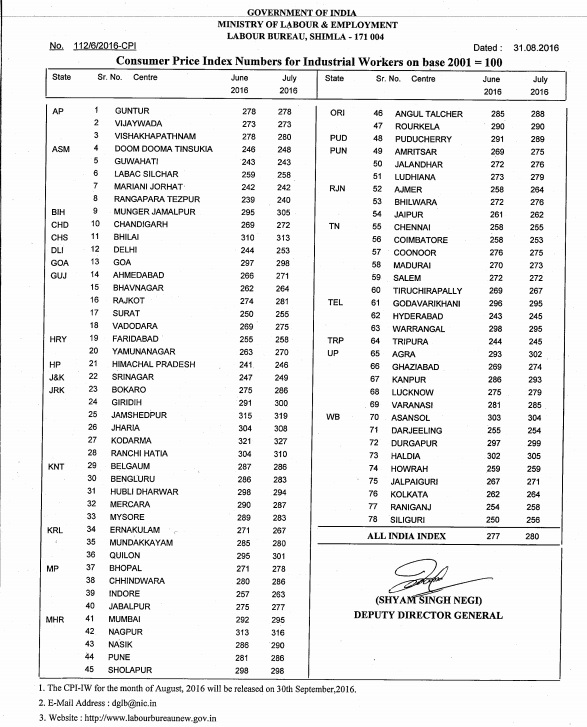
Consumer Price Index for Industrial Workers (CPI-IW) — July, 2016
The All-India CPI-IW for July, 2016 increased by 3 points and pegged at 280 (two hundred and eighty). On 1-month percentage change, it increased by (+) 1.08 per cent between June, 2016 and July, 2016 when compared with the increase of (+) 0.77 per cent between the same two months a year ago.
The maximum upward pressure to the change in current index came from Food group contributing (+) 1.65 percentage points to the total change. The House Rent index further accentuated the overall index by (+) 0.86 percentage points. At item level, Rice, Wheat, Wheat Atta, Besan, Black Gram, Gram Dal, Groundnut Oil, Eggs (Hen), Poultry (Chicken), Milk, Chillies Green, Garlic, Onion, Brinjal, Cabbage, Cauliflower, Gourd, Palak, Potato, Pumpkin, Banana, Sugar, etc. are responsible for the increase in index. However, this increase was checked by Fish Fresh, French Beans, Tomato, Electricity Charges, Petrol, etc. putting downward pressure on the index.
The year-on-year inflation measured by monthly CPI-IW stood at 6.46 per cent for July, 2016 as compared to 6.13 per cent for the previous month and 4.37 per cent during the corresponding month of the previous year. Similarly, the Food inflation stood at 9.34 per cent against 8.33 per cent of the previous month and 3.21 per cent during the corresponding month of the previous year.
At centre level, Bokaro reported the maximum increase of 11 points followed by Munger-Jamalpur (10 points), Giridih, Agra and Delhi (9 points each). Among others, 7 points increase was observed in 4 centres, 6 points in 10 centres, 5 points in 5 centres, 4 points in 9 centres, 3 points in 8 centres, 2 points in 8 centres and 1 point in 5 centres. On the contrary, Mysore recorded a maximum decrease of 6 points followed by Mundakkayam and Coimbatore (5 points each), and Hubli Dharwar and Emakulam (4 points each). Among others, 3 points decrease was observed in 4 centres, 2 points in 2 centres and 1 point in 5 centres. Rest of the 8 centres’ indices remained stationary.
The indices of 33 centres are above All-India Index and other 43 centres’ indices are below national average. The indices of Vishakhapathnam and Mundakkayam centres remained at par with All-India Index.
The next issue of CPI-IW for the month of August, 2016 will be released on Friday, 30th September, 2016. The same will also be available on the office website www.labourbureaunew.gov.in.

EXPECTED DA CALCULATION FROM JULY 2016
DA is the most important allowance in existing Pay, if you look at the current basic DA is higher.
7th CPC Basic fixation has biggest influenced with the DA value. For this reason, after 7th Pay commission implementation, Central government staffs are looking out for how DA would be available.
In 6th CPC, everyone know how DA was calculated
In the above formula 115.76 was fixed based on the below interpretation
After implementation of Sixth Pay Commission report, Government ordered that the dearness allowance has to be calculated based on All India Consumer Price Index for Industrial Workers (CPI¬IW index) with the base year 2001-100. So, DA with effect from the period 1.1.2006, has to be calculated using average Price CPI-IW index of 536 for 2005 (base 1982-100) adjusted to the base year 2001-100 by dividing the same with the Linking Factor between 1982 and 2001 Series which is 4.63. As a result, the average consumer price index (Industrial workers) for 12 months in 2005 (base 2001-100) was worked out to 115.76.To calculate Dearness Allowance with effect from Jan-06, we need the average of monthly All India Consumer Price Index (IW) with the base year
2001-100 for the preceding 12 months and apply the same in the following formula:
DA – (Average AICPI-115.76)x 100/115.76
For example, to calculate the DA for 01/01/2007, we find that the average AICPI in the year 2007 -118.95. So, D.A. as on 01/01/2007 – (118.95 – 115.76)*100 /115.76 = 2%.
In 7th CPC entire calculation can change if we use the same combination. Let’s see, how this can change?
Based on it, in 2015 (base 2001 =100) Average is 261.40 and by using the same following formula the expected (assumed) DA in 7th CPC would be (261.4-261.4)*100/261.4 = 0% and July (277-261.4)*100/261.4 = 2%
In case the base year 2011-100 is used in 7th CPC, then the linking factor will be changed to calculate the DA Value.

Leave a Reply